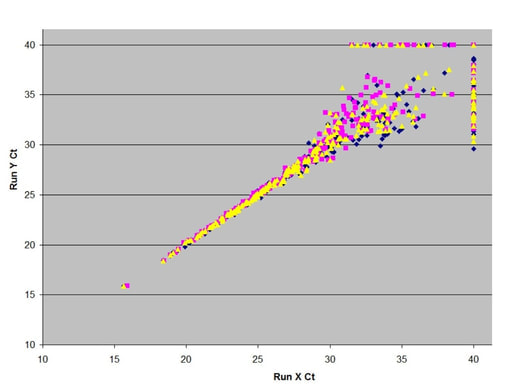
When comparing results from technical replicates, we see little variation in CT values for a specific microRNA when any CT value
is below approximately 28. When a CT value for a specific miRNA is greater than approximately 28, variation between replicates increases. We observe virtually the same pattern whether separate aliquots of the same RNA, or separate aliquots from a single pre-amplification reaction are analyzed. An example of a scatter plot showing three pairwise comparisons (each comparison is a different color) of CT values from three aliquots of the same total RNA sample is shown below.